India's Rooftop Solar Market Hit 27.6 GW - What Investors Should Know
By Hardik BhatiaPublishedWhen evaluating a solar investment, macro data matters - but granular, independently verified market data matters more. Broad statements like "India's solar sector is booming" are easy to find. Detailed breakdowns by state, by consumer segment, by business model, and by developer market share are not.
CRISIL Intelligence, the research arm of CRISIL Ltd. (a company majority-owned by S&P Global), publishes one of the most comprehensive datasets on India's rooftop solar market. Their December 2025 India Solar Rooftop Map provides exactly the kind of granular data that informed investors need: total installed capacity by state, segment-level splits, business model breakdowns, developer rankings, and EPC cost trends.
This blog unpacks the key data points from that report and explains what each one means for US accredited investors evaluating fractional solar opportunities in India.
How Big Is India's Rooftop Solar Market Now?
India's cumulative rooftop solar capacity reached 27,640 MW (27.6 GW) as of December 31, 2025, according to CRISIL Intelligence data. Of that total, 9,220 MW was added in calendar year 2025 alone - a significant acceleration from prior years.
The market breaks down across two important dimensions: consumer segment and business model.
By consumer segment:
Industrial: 12,023 MW (43% of total installed base)
Residential: 10,736 MW (39%)
Commercial: 4,881 MW (18%)
Industrial consumers remain the largest segment by installed capacity, which is significant for investors because many industrial off-takers have stronger credit profiles than smaller commercial or residential consumers and a direct economic incentive to maintain solar PPAs — their grid electricity costs are often among the highest they face.
By business model:
CAPEX: 24,498 MW (89%)
OPEX: 3,142 MW (11%)
This distinction is critical for understanding the investable portion of the market. Under the CAPEX model, the consumer finances and owns the solar system. Under the OPEX model, a third-party investor owns the system, installs it at the consumer's premises, and sells the electricity back under a PPA. The OPEX model is the structure that underpins fractional solar investment — and while it currently represents 11% of total rooftop capacity, it is the segment where investor capital is deployed.
Which States Are Driving the Growth?
India's rooftop solar market is geographically concentrated. According to the CRISIL data, the top five states account for approximately 80% of residential rooftop installations (driven by the PM Surya Ghar scheme), and Gujarat and Maharashtra together represent more than 43% of total installed capacity across all segments.
State-level installed capacity (as of December 2025):
Gujarat: 6,669 MW
Maharashtra: 5,306 MW
Rajasthan: 2,325 MW
Kerala: 1,724 MW
Tamil Nadu: 1,529 MW
Uttar Pradesh: 1,492 MW
Haryana: 1,259 MW
Madhya Pradesh: 1,017 MW
Karnataka: 954 MW
Andhra Pradesh: 953 MW
Gujarat's dominance is driven by a combination of strong solar irradiance, supportive state policy, a large industrial base, and relatively mature open access market structures that make it easier for C&I consumers to procure solar power.
Maharashtra's position reflects the state's massive industrial and commercial economy — Mumbai, Pune, and Nashik are home to thousands of manufacturing facilities and commercial establishments that benefit from replacing expensive MSEDCL grid tariffs with cheaper solar power.
For investors, the geographic concentration matters because it signals where the strongest PPA economics exist. States with high grid tariffs, strong industrial demand, and supportive open access policies produce the most attractive investment opportunities. Gujarat, Maharashtra, Rajasthan, and Tamil Nadu consistently appear in the top tier because the spread between grid electricity costs and solar generation costs is widest in these markets.
Why Is Residential Solar Growing Faster Than C&I?
One of the most striking findings in the CRISIL data is the shift in growth dynamics between consumer segments.
In CY 2025, residential installations reached 5,586 MW - outpacing industrial (2,123 MW) and commercial (1,511 MW) additions combined. This is a reversal from the historical pattern, where C&I installations dominated annual additions.
The catalyst is the PM Surya Ghar scheme, India's national residential rooftop solar subsidy program. Launched in February 2024, the scheme provides central financial assistance for residential solar installations and has driven a surge in adoption. The CRISIL report notes that five states - Gujarat, Maharashtra, Uttar Pradesh, Kerala, and Rajasthan - are driving the residential boom, with the top 10 installers capturing between 8% and 40% market share depending on the state.
For investors in fractional solar, the residential growth story is important context but is not directly investable through the OPEX model in the same way that C&I projects are. Residential installations under PM Surya Ghar are predominantly CAPEX — homeowners own the system, subsidized by the government. The OPEX/RESCO model, where investor capital funds the installation and revenue comes from a PPA, is primarily a C&I phenomenon.
That said, residential growth may strengthen the broader solar ecosystem. It drives manufacturing scale (which can reduce panel and inverter costs), expands the installer workforce, and normalizes solar adoption across the country — all of which could indirectly benefit the C&I segment that investors access through fractional ownership.
Who Are the Top Project Developers — and Why Does It Matter for Investors?
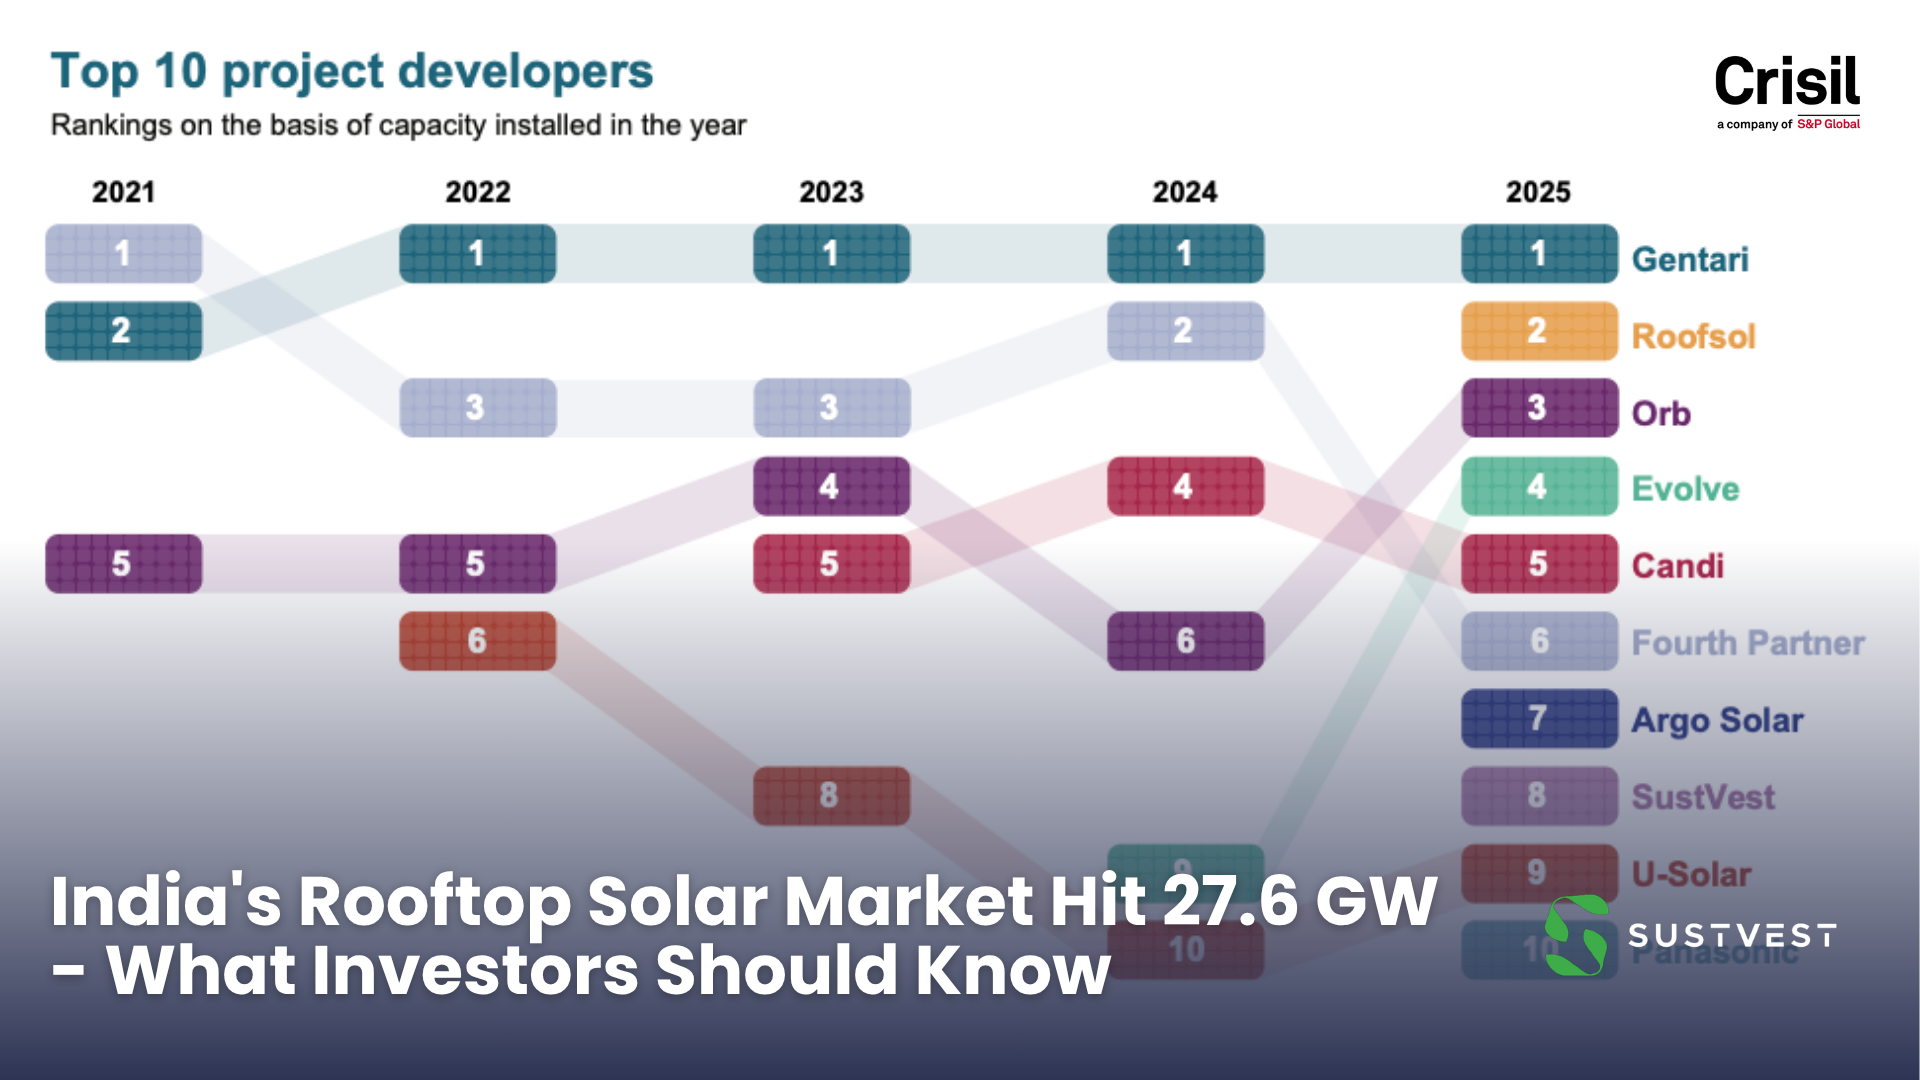
CRISIL ranks India's rooftop solar project developers annually by capacity installed during the calendar year. Project developers in this context are companies that develop, own, and operate solar projects under the OPEX/RESCO model — the segment most relevant to fractional solar investors.
CRISIL's Top 10 Project Developers by capacity installed in CY 2025:
Gentari India
Roofsol
Orb Energy
Evolve Energy
Candi Solar
Fourth Partner Energy
Argo Solar
SustVest
U-Solar
Panasonic
The total project developer market size was 370 MW in CY 2025, reflecting the relatively nascent but growing OPEX segment.
For investors, third-party developer rankings matter for a specific reason: they provide independent validation of a platform's operational presence and market activity. When an accredited investor is evaluating a fractional solar offering, one of the due diligence questions is whether the platform has a verifiable track record of developing and operating solar projects. A ranking by CRISIL Intelligence — part of CRISIL Ltd., one of India's most widely referenced credit and market research institutions — provides exactly this kind of independent evidence.
SustVest's inclusion at #8 in the CRISIL ranking reflects the company's position as an active project developer in India's OPEX rooftop solar market. For US investors evaluating the platform through our 31-point due diligence checklist, this is relevant to checklist item #6 (evaluate operating history) - it is third-party confirmation that the platform is building and operating real solar projects at a scale recognized by independent market researchers.
It is worth noting that the project developer rankings represent capacity installed under the OPEX model specifically, where the developer retains ownership and sells electricity under a PPA. This is distinct from the EPC contractor rankings (where the contractor builds the system but does not own it), which is a much larger market at 9,220 MW. The OPEX developer market is smaller but growing — and it is the segment that directly corresponds to the fractional solar investment model.
What Does the CAPEX vs OPEX Split Tell Investors?
The CAPEX-to-OPEX ratio in India's rooftop solar market is one of the most important structural indicators for fractional solar investors - and it is evolving.
As of December 2025, the split stands at 89% CAPEX and 11% OPEX. In CY 2025 specifically, 8,850 MW was installed under the CAPEX model and 370 MW under OPEX - meaning OPEX accounted for approximately 4% of new additions in 2025.
At first glance, this might seem discouraging for investors - the OPEX segment is small. But the context tells a different story.
One likely reason the OPEX share remains low is the rapid expansion of subsidized residential CAPEX installations under PM Surya Ghar. Within the C&I segment specifically, OPEX penetration is significantly higher and growing. Large industrial and commercial consumers increasingly prefer the OPEX model because it requires zero upfront capital — the developer funds the installation, and the consumer simply pays a per-unit electricity rate that is lower than their grid tariff. The consumer saves money from day one without deploying their own capital.
If adoption continues to expand among C&I consumers, the OPEX project pipeline could grow further. For fractional solar investors, this would mean a growing supply of projects structured exactly the way their investments work: third-party-owned solar assets, installed at a consumer's premises, generating revenue through long-term PPAs.
The CRISIL data also shows that EPC costs have increased due to higher commodity prices and surging demand for ALMM List II-compliant modules. Corporate EPC costs for a typical 500 kW installation rose from approximately ₹32.23/Wp to ₹47.23/Wp between Q3 2022 and Q4 2025. Higher EPC costs can place upward pressure on PPA pricing, although actual tariffs depend on market conditions, competition, financing terms, and contract negotiations.
What Does This Data Mean for US Investors in Indian Solar?
The CRISIL report provides a data-backed snapshot of the market that underpins fractional solar investment returns. Here is what the key data points signal for investors:
The market is large and growing. At 27.6 GW installed and 9.2 GW added in a single year, India's rooftop solar market has reached meaningful scale. This is not a speculative early-stage market — it is a functioning, multi-gigawatt industry with established supply chains, experienced developers, and a growing base of sophisticated off-takers.
The C&I segment remains the investment backbone. Industrial and commercial installations account for 61% of the total installed base (12,023 MW industrial + 4,881 MW commercial). These are the segments where PPA economics are strongest, off-taker creditworthiness is highest, and the OPEX model is most prevalent. For fractional solar investors, C&I is where the returns are generated.
Independent third-party market data exists. CRISIL's developer rankings provide data that investors may use as one component of due diligence. When a platform like SustVest appears in a CRISIL ranking, it provides independently verifiable confirmation of market activity — distinct from the platform's own claims.
The OPEX model is early but expanding. At 11% of total capacity, the OPEX segment is still a fraction of the overall market - but it represents the fastest path to scale for fractional solar investment. As C&I OPEX adoption grows, the pipeline of investable projects grows with it.
Geographic concentration creates clarity. Gujarat and Maharashtra alone account for over 43% of total installed capacity, and the top states consistently dominate both cumulative capacity and annual additions. This means investors can focus their understanding on a manageable number of regulatory environments, grid tariff structures, and market dynamics.
For a deeper understanding of how fractional solar investment works within this market structure, see our pillar guide: How Fractional Solar Investment Works: A Guide for US Investors.
Frequently Asked Questions
What is the difference between CAPEX and OPEX rooftop solar? Under the CAPEX model, the consumer finances and owns the solar system — they pay the upfront cost and benefit from reduced electricity bills over the system's life. Under the OPEX model, a third-party developer (or investor group) funds, owns, and operates the solar system at the consumer's premises. The consumer pays no upfront cost and instead purchases the solar electricity at a rate lower than their grid tariff under a PPA. The OPEX model is the structure that underlies fractional solar investment — investors own the asset, and returns come from PPA revenue.
How does CRISIL rank project developers? CRISIL Intelligence ranks project developers based on capacity installed during the calendar year. The ranking covers developers operating under the OPEX/project developer model specifically — companies that own and operate solar projects at consumer premises. CRISIL's methodology involves extensive data collection from project developers, equipment suppliers, and state nodal agencies, cross-referenced with government data where possible. CRISIL notes that they do not guarantee completeness or accuracy of all information, but the report is widely regarded as one of the most comprehensive datasets on India's rooftop solar market.
Does SustVest's CRISIL ranking affect investor returns? Not directly. The CRISIL ranking does not change the PPA terms, generation output, or distribution mechanics of any specific solar project. What it does provide is independent, third-party validation that SustVest is an active project developer in India's rooftop solar market — which is relevant to investor due diligence. When evaluating a private offering, knowing that the platform's development activity is tracked and ranked by CRISIL, one of India's leading market research institutions, adds a layer of independent verification beyond the platform's own disclosures.
About Sustvest
SustVest LLC is a Delaware-registered fractional solar investment platform offering SEC Regulation D 506(c) compliant investment opportunities in Indian solar energy projects. Through its US entity structure, Sustvest enables accredited investors and NRIs to own membership interests (units) in operating solar projects backed by long-term Power Purchase Agreements. Each project is held in a separate Indian SPV, with SustVest LLC owning 100% of each SPV. Investors receive proportional monthly cash distributions in USD, with a minimum investment of $500 and target returns of 10–14% XIRR (projected, not guaranteed). Project details, SEC filings, and real-time generation data are available at sustvest.com.
This content is for informational purposes only and does not constitute an offer to sell or a solicitation of an offer to buy any securities. Investments in private offerings under SEC Regulation D are speculative, illiquid, and involve a high degree of risk, including the potential loss of the entire investment. Fractional solar investments are available only to verified accredited investors as defined under SEC Rule 501(a). Past performance is not indicative of future results. The CRISIL ranking cited in this blog reflects capacity installed in CY 2025 and does not constitute an endorsement of SustVest by CRISIL, S&P Global, or any affiliated entity. CRISIL states that the report is not a recommendation to invest and no part should be construed as expert or investment advice. Prospective investors should carefully review the Private Placement Memorandum (PPM) and consult with their own legal, tax, and financial advisors before making any investment decision. SustVest LLC does not provide investment, legal, or tax advice.
Sources:
CRISIL Intelligence (CRISIL Ltd., majority-owned by S&P Global) — "India Solar Rooftop Map December 2025": Total installed capacity 27,640 MW; CY 2025 additions 9,220 MW
CRISIL Intelligence — Consumer segment split: Industrial 12,023 MW, Residential 10,736 MW, Commercial 4,881 MW
CRISIL Intelligence — Business model split: CAPEX 24,498 MW (89%), OPEX 3,142 MW (11%)
CRISIL Intelligence — State-level capacity data: Gujarat 6,669 MW, Maharashtra 5,306 MW, Rajasthan 2,325 MW, Kerala 1,724 MW, Tamil Nadu 1,529 MW
CRISIL Intelligence — Top 10 Project Developers CY 2025: Gentari, Roofsol, Orb Energy, Evolve Energy, Candi Solar, Fourth Partner Energy, Argo Solar, SustVest, U-Solar, Panasonic
CRISIL Intelligence — Project developer market size: 370 MW (CY 2025)
CRISIL Intelligence — CY 2025 segment additions: Residential 5,586 MW, Industrial 2,123 MW, Commercial 1,511 MW
CRISIL Intelligence — EPC cost trend: Corporate 500 kW system cost rose from ~₹32.23/Wp (Q3 2022) to ~₹47.23/Wp (Q4 2025)
CRISIL Intelligence — CY 2025 business model additions: CAPEX 8,850 MW, OPEX 370 MW (4% OPEX share in new additions)
CRISIL Intelligence — "Top five states account for ~80% of [residential] installations"; PM Surya Ghar scheme driving residential surge