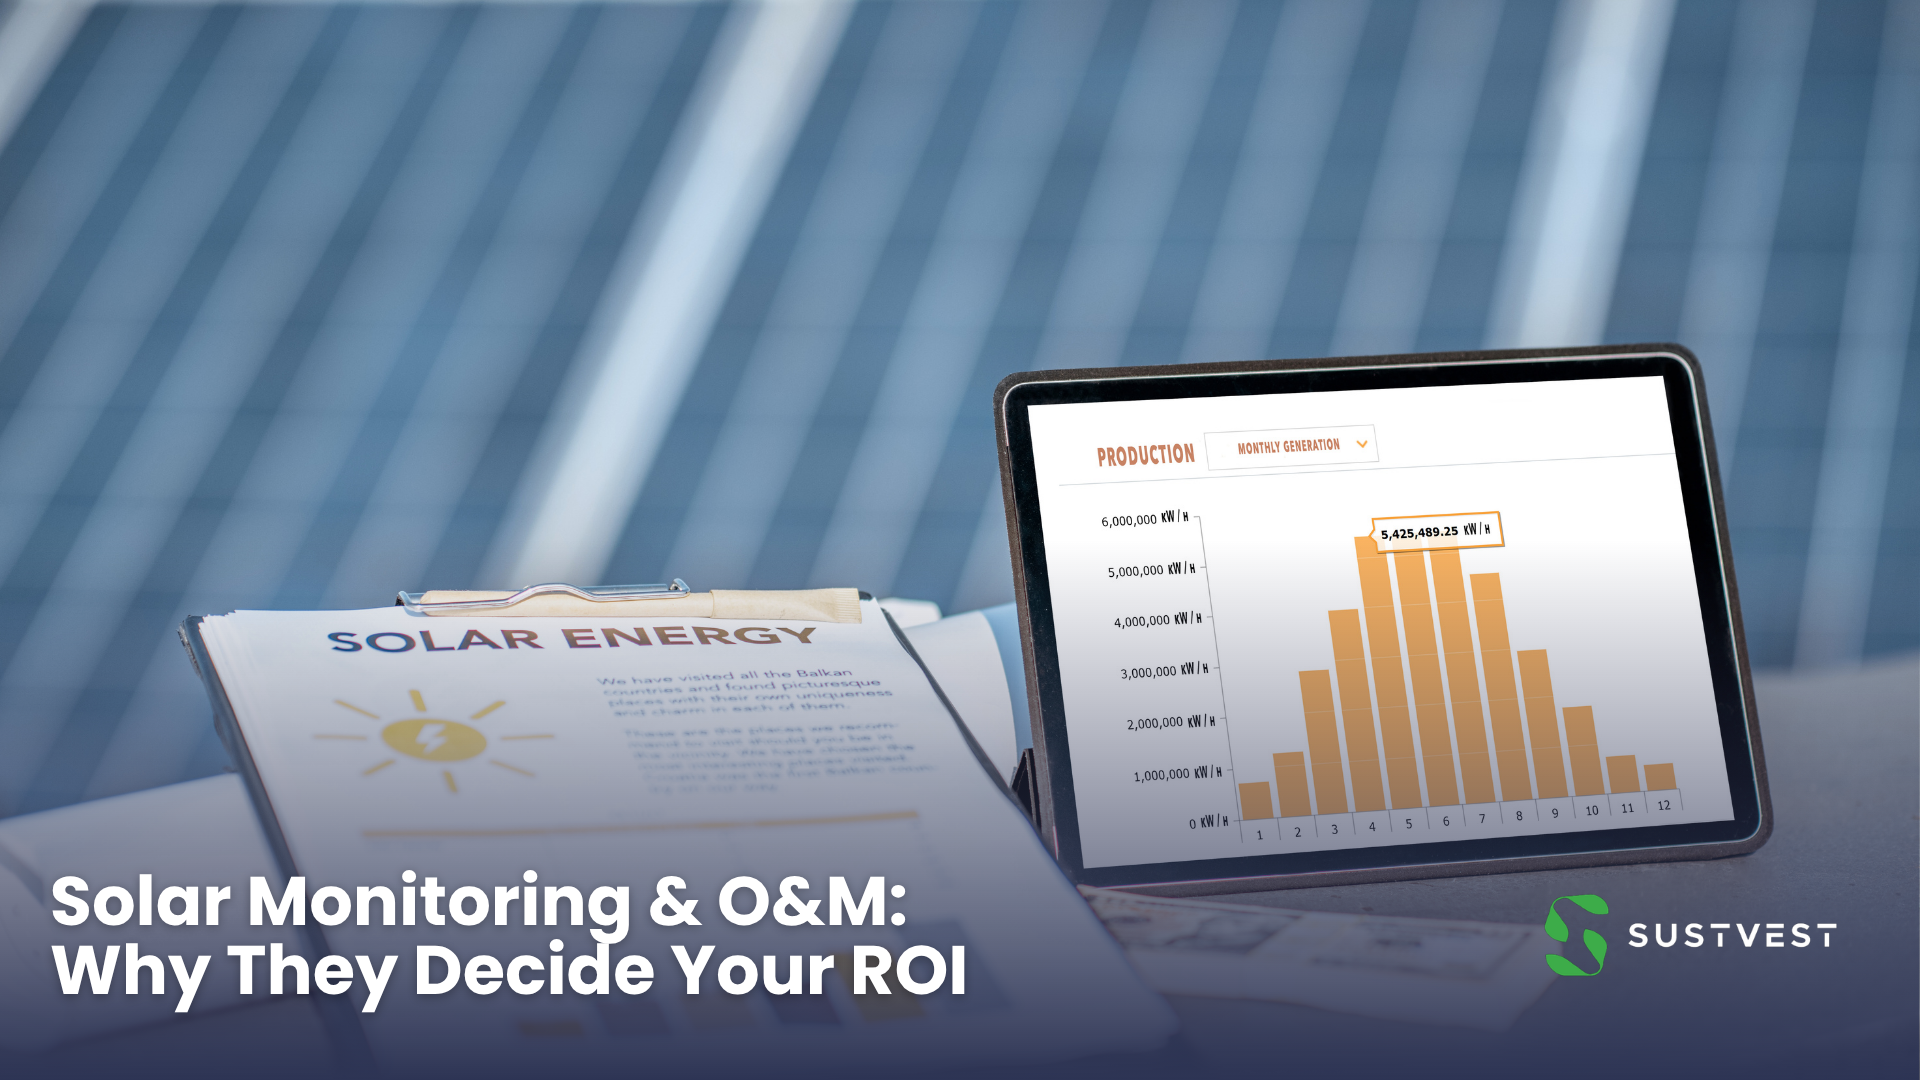
Solar Monitoring & O&M: Why They Decide Your ROI
Most of the attention in a solar project goes into the decision to build it — the funding model, the tariff, the payback. But a solar plant's actual return isn't set the day it's commissioned; it's earned every day over its operating life. And whether it delivers the generation your financial model assumed depends not only on how the system was designed and commissioned, but also on how effectively it's monitored and maintained after it goes live — something buyers tend to underweight. A well-built plant that's poorly monitored quietly loses output; a well-run one defends every unit. For a C&I buyer, monitoring and O&M aren't an afterthought — they're where the ROI is protected or lost.
A solar plant's return depends on it actually generating what it was designed to — and generation quietly degrades over time from soiling, shading, equipment faults, string failures, and grid outages. Monitoring is how you see those losses; O&M is how you fix them. A core metric is Performance Ratio (PR) — a measure of how effectively a system converts the solar irradiance available to it into usable electricity, after normalising for the amount of sunlight received — because it helps distinguish a plant performance problem from a simply cloudy period. Since plant generation is a key driver of energy savings or PPA revenue, a sustained performance decline can have a direct financial impact that compounds over the project's operating life. Good monitoring catches deviations early (comparing actual generation against expected output from irradiance and weather data), and structured O&M resolves them before they become real losses. For a C&I buyer, this after-commissioning layer is where the promised savings are either protected or eroded.
Here's why it matters and what good looks like.
Why does monitoring matter so much for solar ROI?
Because a solar plant's financial model assumes a certain level of generation, and every unit it falls short is revenue lost — but you can't fix what you can't see. Underperformance is rarely dramatic. It's a gradually soiling array, one shaded or failed string, an inverter running below spec, a grid outage that went unlogged. Individually these look minor; collectively, and left unaddressed, they add up to meaningful lost production over a year — and far more over the plant's life.
The metric that captures this is Performance Ratio (PR) — a measure of how effectively a PV system converts the solar irradiance available to it into usable electricity, after normalising for the amount of sunlight received. PR is one of the most useful high-level indicators for assessing whether a plant is performing as expected, because it helps distinguish changes in plant performance from changes in available irradiance. (It normalises for irradiance but is still affected by factors like temperature, so it's read alongside energy delivery and availability, not in isolation.) Crucially, because plant generation is a key driver of energy savings or PPA revenue, a sustained decline in performance can have a direct financial impact: a plant whose PR is quietly drifting down is losing money its owner may not even realise — which is exactly why visibility matters.
Monitoring is what makes PR (and the losses behind it) visible. Without it, problems surface late — often only when someone notices the electricity bill didn't fall as expected, by which point months of generation may already be gone.
What does a solar monitoring platform actually show?
A good platform gives you a single, portfolio-wide view of how every plant is performing against expectation — and flags where attention is needed. Instead of data scattered across multiple inverter portals with no unified view, a monitoring platform centralises it. The SustVest monitoring platform, for example, is built around exactly this problem — giving operations and asset teams a daily snapshot of portfolio health. Key things a strong platform surfaces:
Portfolio overview — total actual generation for the day, forecasted generation for the same period, the deviation between them, and which plants are top- or under-performing.
Forecasting vs actual — expected generation modelled from location-specific irradiance and weather data, compared against what the plant actually produced, with the deviation shown in both energy units and percentage. This is the heart of catching underperformance early.
String-level diagnostics — many performance issues are invisible at plant level. String-level analysis compares each string's output, groups by inverter, and flags health as excellent, OK, warning, or critical — helping uncover or investigate issues such as shading, thermal effects, or partial failures that a plant-level number could mask.
Grid loss and alarms — tracking grid unavailability and breakdown losses, with alarm classification, so true loss drivers are identified rather than guessed.
Daily and monthly readings — generation values, rolling averages, and comparison against benchmarks, which reveal gradual performance drift and seasonal patterns.
The value isn't the data itself — it's turning data into a short list of what needs attention today, so teams act on the plants that are actually losing output.
How does monitoring catch underperformance early?
By continuously comparing what the plant should generate against what it actually generated, and flagging the gap. A monitoring platform estimates expected output using location-specific irradiance and weather data, then measures the deviation against real generation. A plant producing meaningfully less than expected — after accounting for the weather — has a problem worth investigating, and the platform surfaces it rather than leaving it buried in an inverter portal.
This "actual vs expected" comparison is what separates real monitoring from just reading a generation number. A plant can generate less simply because it was a cloudy week — that's not a fault. But a plant generating less than the irradiance says it should is losing recoverable output, and that distinction is exactly what a good platform makes visible. From there, string-level diagnostics narrow it down: if one section underperforms while the rest remain stable, the pattern can help narrow the investigation toward a localised issue — shading, a connector fault, or a string-level problem — rather than immediately assuming a plant-wide cause like soiling. That precision is what makes the fix faster and cheaper than investigating blind.
What is solar O&M, and what does good O&M include?
O&M (operations and maintenance) is the structured programme that keeps a plant generating at its designed level — it's what turns monitoring insights into recovered output. Monitoring tells you what's wrong; O&M is fixing it, and doing the preventive work that stops problems arising. Good C&I O&M is a coordinated programme, not an occasional cleaning visit. It typically includes:
Performance monitoring — tracking generation against expected output to catch issues early (the layer above).
Preventive maintenance — scheduled inspections and servicing that catch problems before they cause downtime, rather than waiting for failures.
Cleaning, informed by data — soiling can be a significant recoverable source of energy loss, particularly at sites exposed to dust and other particulate accumulation. Where suitable data is available, cleaning can be scheduled using measured soiling and generation trends rather than relying solely on a fixed calendar — cleaning when it pays to.
Corrective maintenance — responding to faults, string failures, and underperformance once identified, quickly enough to limit lost generation.
Issue tracking and documentation — logging issues, assignments, and resolutions, creating a maintenance history linked to plant performance (useful for warranty claims, asset value, and accountability).
The distinction that matters: a purely corrective approach — fixing things after they break — can reduce planned maintenance activity, but it also increases the risk of prolonged downtime and unrecovered generation when faults are detected late. A structured, monitoring-led O&M programme is what keeps a plant near its designed performance over its operating life.
How do monitoring and O&M protect a C&I buyer's returns specifically?
They defend the generation your savings depend on — whether you own the system or buy the power under a PPA. The link to ROI is direct:
Under CAPEX (you own the system), every unit of underperformance is a unit of savings you paid for but didn't get. Monitoring and O&M protect the return on the capital you deployed.
Under OPEX/RESCO (you buy the power), a capable developer's monitoring and in-house O&M help ensure the plant continues to deliver the contracted power and expected operating performance — which is why a developer's O&M capability is one of the most important things to assess before signing, as we note in our PPA terms checklist.
Either way, the after-commissioning layer is where the numbers in your business case are defended. A plant that's designed and funded well can still underdeliver against its model if performance issues aren't detected and addressed promptly; one that's actively monitored and maintained is far more likely to hold its output — and its economics. This is also why the quality of a developer's monitoring and O&M is a genuine differentiator, not a commodity. For SustVest specifically, keeping monitoring and O&M in-house means the same team identifies issues, dispatches corrective action, and tracks resolution through one operating workflow — rather than detection and repair sitting with different parties.
How often should a solar plant be reviewed?
A practical cadence works in layers: daily, weekly, and monthly. Not every review needs the same depth, and a good monitoring platform supports all three:
Daily — review the portfolio overview for deviations and any inactive or underperforming plants, so problems are caught within a day rather than a month.
Weekly — analyse trends, regional performance, and recurring issues, spotting patterns a single day wouldn't reveal.
Monthly — review plant benchmarks, cleaning cycles, and gradual performance drift, and generate the reports finance and asset teams need.
This layered rhythm is how a portfolio stays close to its designed generation: daily catches the acute problems, monthly catches the slow drift, and weekly ties the two together. The point isn't constant vigilance — it's a structured routine that surfaces the right issues at the right time.
The bottom line for C&I buyers
The decision to go solar gets the attention, but the return is earned over the project's operating life after commissioning — and that return depends on generation the plant only delivers if it's properly monitored and maintained. Performance Ratio helps reveal performance deterioration, while soiling, faults, and downtime can quietly erode generation and economics, and the difference between a plant that hits its model and one that underdelivers is almost always the after-commissioning layer: visibility into what's happening, and a structured programme to act on it. When you evaluate a solar project — or a solar developer — treat monitoring and O&M not as a line item but as the thing that decides whether your business case actually materialises. It's where solar ROI is protected or lost.
SustVest is a solar asset owner and operator with capabilities spanning development, EPC, monitoring, and O&M — we run a distributed portfolio of rooftop plants and manage them through our own monitoring platform, with in-house operations and maintenance. That means the plants we build for C&I clients are backed by portfolio-wide forecasting-vs-actual tracking, string-level diagnostics, and grid-loss analysis, with the same in-house team identifying issues, dispatching corrective action, and tracking resolution — the tools and workflow we use to run our own assets. Ranked #8 in CRISIL Intelligence's CY2025 Top 10 rooftop solar project-developer ranking (India Solar Rooftop Map, December 2025), with 84+ projects delivered across 13+ states (company-reported figures). Book a free site assessment to see how we'd monitor and maintain your plant for the long run.
Frequently Asked Questions
Why is monitoring important for a solar plant? A solar plant's return depends on it generating what its financial model assumed, and generation quietly degrades from soiling, shading, equipment faults, and string failures. Monitoring makes those losses visible — chiefly through Performance Ratio, which normalises output against the irradiance received — so problems are caught early. Without monitoring, underperformance often surfaces only when the electricity bill doesn't fall as expected, by which point months of generation may be lost.
What is Performance Ratio (PR) in solar? Performance Ratio normalises a system's output against the solar irradiance it received, making it a useful high-level indicator of how effectively the PV system is performing and helping distinguish plant performance changes from changes in available sunlight. It's read alongside energy delivery and availability rather than in isolation. Because plant generation is a key driver of savings or PPA revenue, a sustained decline in performance can have a direct financial impact.
What does solar O&M include beyond cleaning? Good O&M is a coordinated programme, not just panel cleaning. It typically includes performance monitoring (tracking generation against expected output), preventive maintenance (scheduled inspections that catch problems before downtime), data-informed cleaning (scheduled by measured soiling and generation trends where available rather than solely a fixed calendar), corrective maintenance (fixing faults and underperformance once identified), and issue tracking and documentation linked to plant performance.
How does monitoring catch underperformance early? A monitoring platform estimates expected generation from location-specific irradiance and weather data, then compares it against actual output and flags the gap. This "actual vs expected" comparison distinguishes a genuinely underperforming plant from one that simply had a cloudy week. String-level diagnostics then help narrow the cause — if one section underperforms while others hold steady, the pattern points the investigation toward a localised issue (shading, a failed connector, a string fault) rather than immediately assuming a plant-wide cause.
Does monitoring and O&M matter if I'm on an OPEX/PPA model? Yes — arguably more so. Under OPEX/RESCO the developer owns and operates the plant, so its monitoring and O&M capability is important to maintaining the plant's expected operating performance and contracted power delivery. This is why a developer's in-house monitoring and O&M is one of the most important things to assess before signing a PPA.
How often should a commercial solar plant be reviewed? A practical cadence works in layers: daily review of the portfolio overview for deviations and inactive plants; weekly analysis of trends, regional performance, and recurring issues; and monthly review of plant benchmarks, cleaning cycles, and gradual performance drift. Daily catches acute problems, monthly catches slow drift, and weekly ties the two together.
Sources
SustVest Solar Monitoring Platform & O&M pages — platform capabilities: portfolio overview (actual vs forecasted generation, deviation, top/under-performers), forecasting from irradiance/weather data, string-level diagnostics, grid loss & alarms, daily/monthly readings, in-house O&M (monitoring → dispatch → repair → issue tracking), cleaning, yield analytics, warranty management; SustVest as a solar asset owner/operator running its own portfolio
NREL — Best Practices for Operation and Maintenance of Photovoltaic and Energy Storage Systems (O&M programme design; performance, availability, and energy delivery)
PV Performance Modeling Collaborative (Sandia National Laboratories) — Performance Ratio definition and IEC 61724 basis (irradiance normalisation; temperature sensitivity)
IEA PVPS Task 13 — guidelines for operation and maintenance across climates
CRISIL Intelligence — India Solar Rooftop Map, December 2025 (SustVest #8, CY2025 project-developer ranking — confirm against the report)
SustVest — 84+ projects, 13+ states (company-reported figures)