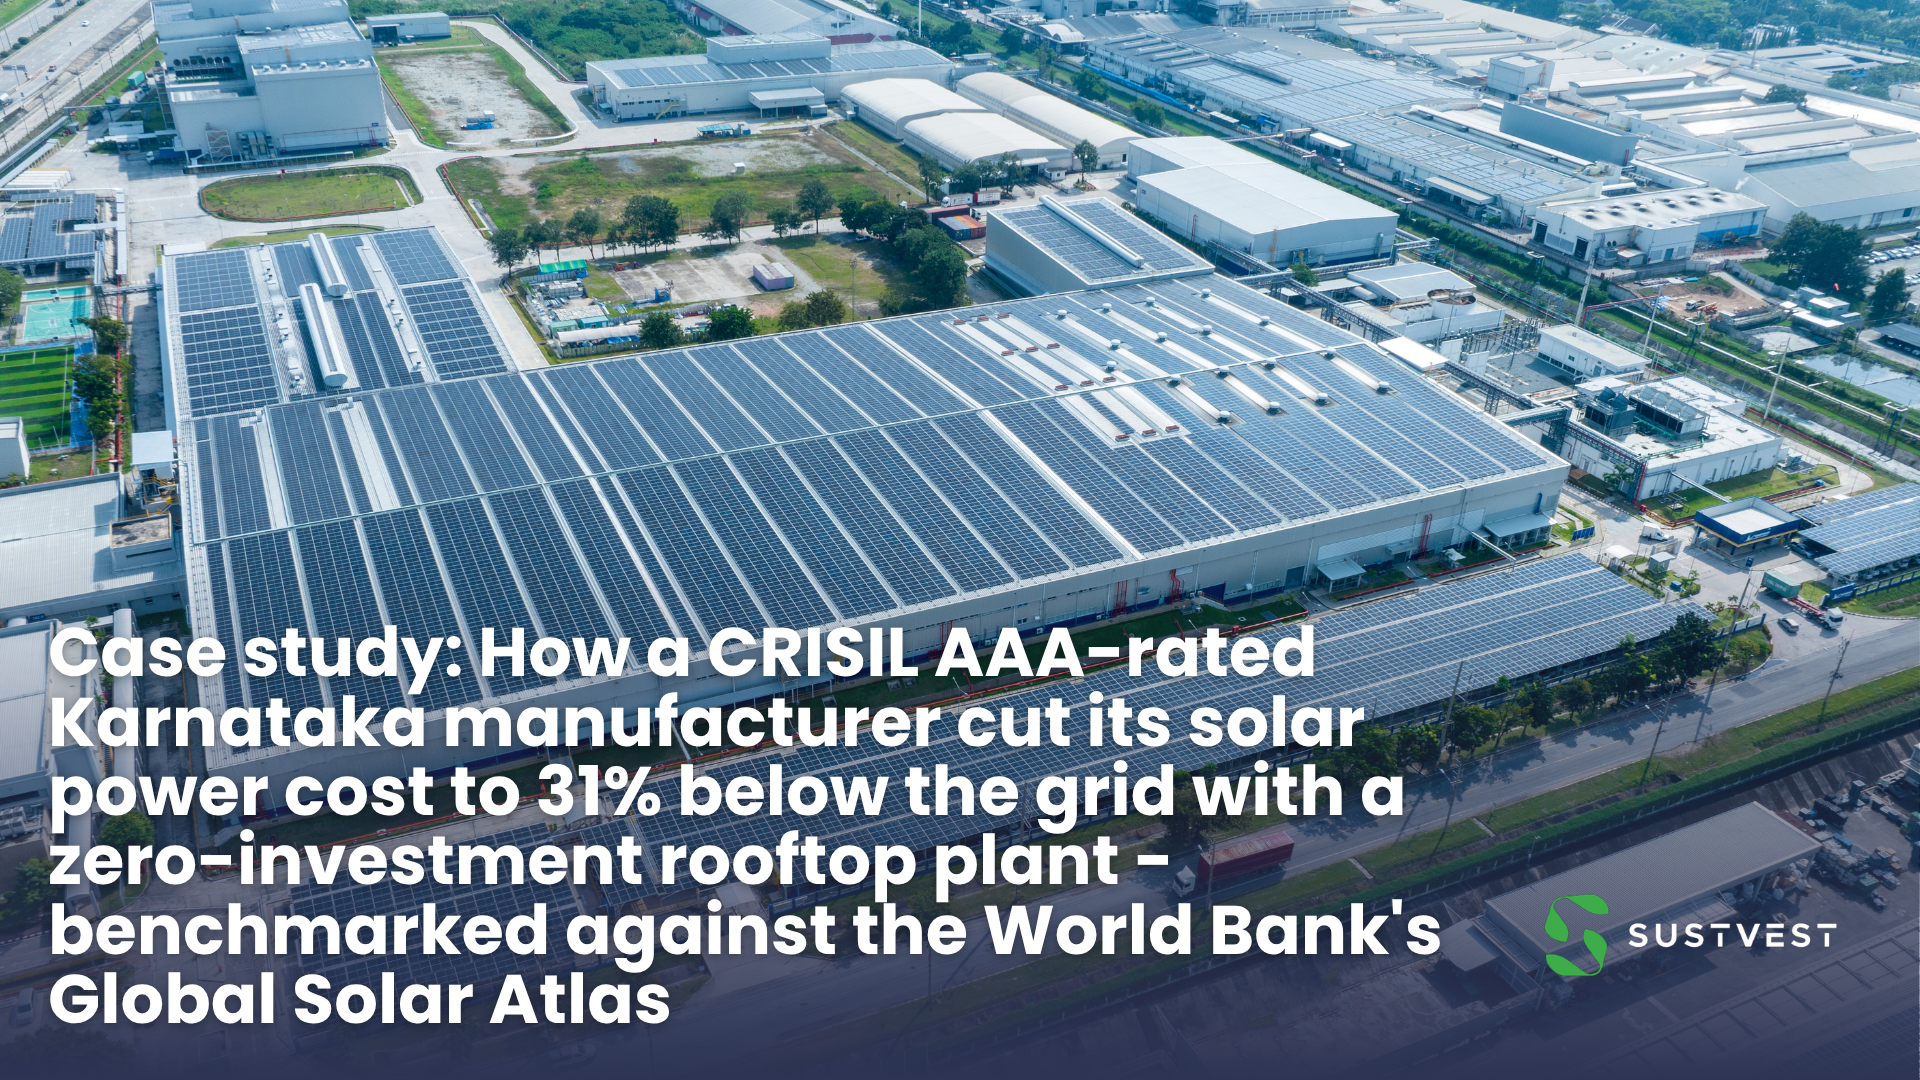
Case study: How a CRISIL AAA-rated Karnataka manufacturer cut its solar power cost to 31% below the grid with a zero-investment rooftop plant - benchmarked against the World Bank's Global Solar Atlas
A large electrical-equipment manufacturer - rated CRISIL AAA/Stable on its long-term bank facilities and CRISIL A1+ on its short-term facilities — at a plant near Bengaluru, Karnataka replaced part of its daytime grid power with a 600 kWp rooftop solar plant on a zero-investment RESCO model. It put in no capital, pays only for the units the roof generates at ₹5.15 per unit against a grid rate of ₹7.43, and has saved about ₹34.7 lakh from commissioning in December 2024 to the meter reading dated 31 August 2026. The generation and the savings are not projections — they come straight off the meter and the monthly invoice. As a sense-check on performance, metered output has also been compared against the World Bank Group's Global Solar Atlas, a long-term modelled estimate for the site; over March–August 2026 the plant ran at about 91% of that model.
All customer generation and financial figures are drawn from SustVest invoices and meter readings. Global Solar Atlas figures are modelled estimates, and the CO₂ figure is a calculation based on metered generation and the stated emission factor — none of these are an independent audit of the plant. We have kept the customer unnamed at their request; what matters for a buyer evaluating this model is the structure and the numbers, both of which are below in full.
Who the customer is
The customer is a multinational electrical-equipment manufacturer with a production facility in Karnataka. It carries a CRISIL AAA/Stable rating on its long-term bank facilities and CRISIL A1+ on its short-term facilities. CRISIL AAA indicates the highest degree of safety regarding timely servicing of rated long-term financial obligations, and A1+ the strongest comparative standing on the short-term scale. On SustVest's account, this was a customer that could have funded a rooftop plant from its own balance sheet and deliberately chose RESCO instead. That is the interesting part: this was not a company that couldn't afford CAPEX solar. It was a company that decided owning and running a power plant was not where it wanted its capital or its maintenance attention.
We've chosen not to name the customer. The structure, the tariff logic, the metered generation and the benchmarking method are all exactly as delivered.
What is a RESCO rooftop solar model, in one paragraph?
RESCO (Renewable Energy Service Company), also called the OPEX or zero-investment model, means the solar developer finances, builds, owns and operates the rooftop plant on your roof. You pay nothing upfront. You buy the electricity the plant generates at a fixed per-unit tariff that sits below your grid rate, billed monthly on an actual meter reading. The developer handles cleaning, monitoring and maintenance for the whole contract term, and the plant transfers to you at the end. Your saving is simply the gap between your grid tariff and the solar tariff, multiplied by every unit the roof produces.
How is RESCO different from buying the plant yourself (CAPEX)?
Under CAPEX you own the asset and benefit from the electricity it generates without paying a per-unit solar PPA tariff — while continuing to bear the applicable operating costs — but you fund it, you carry the performance risk, and you maintain it. The qualitative trade-off:
Upfront cost: CAPEX requires a significant capital outlay; RESCO requires none.
When savings start: CAPEX can reduce electricity costs from commissioning, with the initial investment recovered over the payback period; RESCO avoids the upfront investment and can deliver savings from the first month, depending on the PPA and actual generation.
Maintenance: under CAPEX, operations and maintenance are your cost and responsibility; under RESCO, the developer's.
Performance risk: under CAPEX a weak generation year is your loss; under RESCO you pay only for the units actually generated.
End of term: under this project's RESCO agreement, the plant transfers to the customer at the end of the contract.
(Exact CAPEX cost, payback period and O&M expenditure vary widely with system design, roof condition, tariff, financing and maintenance scope, so we've kept this comparison qualitative rather than quoting benchmark figures. Model your own case on your actual numbers.)
For a company that wants the savings without the capital lock-in or the operational overhead, RESCO is the lighter-weight route. That is the trade this Karnataka manufacturer made.
The problem: a large daytime load paying ₹7.43 a unit
The plant runs a heavy daytime electrical load on grid power, and it had a large, unshaded metal-sheet industrial roof sitting idle above that load. Its grid tariff — the HT industrial rate from its local distribution utility — worked out to ₹7.43 per unit, which is the rate used for every savings figure in this case study.
And that grid rate doesn't stand still. Industrial tariffs in India typically climb 3–5% a year as utilities revise their rates, so the cost of doing nothing rises every year. A RESCO PPA tariff, by contrast, is fixed for the contract term — so the saving per unit actually widens over time as the grid rate keeps rising against a flat solar tariff.
The brief to us was narrow and practical: cut the cost of daytime power, without investing capital and without taking on the running of a power plant.
The solution: a 600 kWp RESCO plant at ₹5.15 per unit
SustVest financed, engineered and built a 600 kWp rooftop solar plant on the facility's main production shed — zero capex for the customer. The plant was commissioned in December 2024, modelled in 3D on satellite imagery with sun-path and shading simulation before a single module went up, and sits on a metal-sheet roof with walkways and safety rails.
What the customer gets under this project's PPA:
Solar power at a fixed ₹5.15 per unit — 31% below the ₹7.43 grid rate, a saving of ₹2.28 on every unit the roof generates.
Zero capital outlay — the plant is financed and owned by SustVest.
No operations or maintenance responsibility — SustVest owns, operates, cleans and maintains the plant for the full PPA term.
Billing only on generation — the customer pays for metered units each month, with no minimum and no fixed charge.
Plant transfer to the customer at the end of the contract term.
These are the terms of this particular agreement; RESCO contracts differ, so the specifics — term length, transfer conditions, payment and termination clauses — are what matter, not a generic promise.
There is one more detail that matters to a finance team: the supply of electrical energy is exempt from GST. On this project the invoices are raised with no GST, citing Notification 2/2017-Central Tax (Rate), Sr. No. 104. The exact tax treatment of any RESCO invoice should be confirmed against the applicable notification, the PPA and the nature of the amounts charged — worth a quick check with your GST adviser.
The numbers: what six months actually looked like
Over March to August 2026, the plant generated 4,26,831 units (kWh) (the sum of the six monthly readings below), billed at ₹5.15 per unit. Month by month, the metered generation was:
March 2026: 81,960 units
April 2026: 81,213 units
May 2026: 76,139 units
June 2026: 71,242 units
July 2026: 57,557 units
August 2026: 58,720 units
How much did the customer save in those six months?
Against the ₹7.43 grid rate, those same units would have cost about ₹31.71 lakh from the grid. The customer paid SustVest about ₹21.98 lakh for the solar power. The difference — ₹9.73 lakh saved in six months, roughly 31% lower than grid — is money that stayed on the customer's P&L instead of going to the utility.
The drop in generation across the monsoon months (June–August) is expected and visible in the data; solar is seasonal, and an honest case study shows the low months, not just the high ones.
The part most case studies skip: how does generation compare to an outside benchmark?
Any developer can quote a glossy annual-savings number. A more useful question is how the plant's metered output compares against an outside reference — not the developer's own optimistic projection.
What is the benchmark, and what it is not
We compare this plant against the World Bank Group's Global Solar Atlas (data by Solargis), a satellite-based tool that provides long-term solar resource estimates and modelled PV electricity output for specific locations. For this exact location — 13.2892° N, 77.5722° E — modelled as a 600 kWp system at the installed tilt and azimuth, with the Atlas's default system losses, the Global Solar Atlas estimates:
8,91,111 kWh per year (1,485 kWh per kWp), and
1,919.8 kWh/m² per year of irradiation on the module plane.
Two honest caveats. First, the Global Solar Atlas is a modelled long-term estimate from satellite and meteorological data — it is a planning benchmark, not an independent measurement or audit of this specific plant's output. Second, its terrain-shading calculation does not include building or vegetation shading. So treat the percentages below as "metered output vs a modelled expectation," not as a certified performance guarantee.
So how is the plant tracking against it?
Month by month, metered generation against the Global Solar Atlas modelled estimate for March–August 2026:
March: 82.0k metered vs 94.2k modelled — 87%
April: 81.2k vs 90.7k — 90%
May: 76.1k vs 87.3k — 87%
June: 71.2k vs 72.0k — 99%
July: 57.6k vs 61.2k — 94%
August: 58.7k vs 64.3k — 91%
Across those six months the plant generated about 91% of the Global Solar Atlas modelled estimate (4,26,831 metered vs roughly 4,69,805 modelled units; the monthly figures above are rounded, so the totals are indicative).
A note on the longer view: comparing lifetime generation to the Atlas by simply pro-rating the annual figure (8,91,111 × 21/12 ≈ 15,59,444 units) gives metered output at roughly 98% of that pro-rata number. We'd flag that this is a rough pro-rata, not a true seasonally-adjusted 21-month benchmark — the actual Dec 2024–Aug 2026 window spans specific calendar months, and a precise comparison would sum the Atlas's monthly values for exactly those months. The honest, defensible headline is the six-month figure: ~91% of the modelled estimate over March–August 2026.
Twenty-one months in: the running total
From commissioning in December 2024 to the 31 August 2026 meter reading:
15,21,859 units (kWh) generated — lifetime meter reading.
₹34,69,839 saved against grid cost at ₹7.43 per unit.
₹78.4 lakh paid for solar power at ₹5.15 — the same units would have cost about ₹1.13 crore from the grid.
An estimated ~1,090 tonnes of CO₂ avoided, applying a CEA grid emission factor of 0.716 kg per kWh.
The generation and financial figures are printed on the customer's own SustVest tax invoice (lifetime meter reading and savings tracker). The CO₂ figure is an estimate derived from that metered generation and the stated emission factor — the exact factor should be taken from the current edition of the CEA's CO₂ Baseline Database for the relevant category.
Why the billing itself is part of the value
A RESCO deal is only as good as its transparency, because the customer is trusting a meter reading they don't take themselves. Here is what this customer receives every month:
Units billed on the actual monthly meter reading, with the current and previous reading dates printed on the invoice.
Units × ₹5.15, with no GST (electricity supply is exempt).
Net-45 payment terms by NEFT/RTGS.
A savings tracker on every single invoice: the last six months of units, cost-with-solar versus cost-with-grid, and the lifetime totals.
The customer can audit the deal from one page, every month. There is no annual "trust us" reconciliation.
What a buyer should take from this
If you run a manufacturing or commercial facility with a meaningful daytime load and usable roof, the lesson here isn't "solar saves money" — you already know that. It's that a CRISIL AAA-rated company with full access to capital still chose RESCO, because the real question for most finance teams isn't can we afford a solar plant, it's do we want to own and run one. For this customer the answer was no. The zero-capex model avoided the upfront capital expenditure and shifted the contracted plant-maintenance responsibilities to the developer, while the customer simply paid for the electricity generated under the PPA — at 31% below its grid rate on every unit the roof supplies. (The 31% is the per-unit saving on solar power, not a 31% cut to the facility's entire daytime bill; the rooftop plant covers part of the daytime load, and the total-bill impact depends on how much of that load it displaces.) How much performance risk actually sits with the developer depends on the PPA's own guarantees and remedies; paying only for generated units is one part of that, not the whole of it.
For the wider picture of how C&I rooftop solar works in India — models, policy and economics — see our complete guide to commercial and industrial solar. And because a RESCO deal lives or dies on whether the plant keeps performing, how monitoring and O&M drive C&I ROI is worth a read alongside this case study.
The honest caveats apply: your grid tariff, roof condition, load profile and local net-metering or open-access rules all change the maths, and the right way to size this is to model your own facility, not to copy a number from a case study. Solar is also seasonal — a good month and a monsoon month look very different, as the data above shows.
FAQ
What is a RESCO or OPEX rooftop solar model? RESCO (Renewable Energy Service Company), also called OPEX or zero-investment solar, is a model where the developer finances, owns, builds and operates the rooftop plant. You typically pay nothing upfront and buy only the units generated, at a fixed tariff below your grid rate, billed monthly on a meter reading. The developer typically handles maintenance, and the plant transfers to you at the end of the term. The exact payment, maintenance and transfer terms depend on the individual contract.
How much can a factory save with RESCO solar? The saving is the gap between your grid tariff and the solar PPA tariff, applied to every unit the roof generates. In this Karnataka case the grid rate was ₹7.43 and the solar tariff ₹5.15 — a 31% saving per unit, about ₹9.73 lakh over six months and ₹34.7 lakh from commissioning in December 2024 to the 31 August 2026 meter reading on a 600 kWp plant. Your own saving depends on your tariff, roof and load, so model your facility specifically.
Is RESCO solar better than buying the plant (CAPEX)? Neither is universally better. Under CAPEX you own the asset and benefit from its electricity without paying a per-unit solar tariff (while still bearing operating costs); it can lower bills from commissioning, with the initial investment recovered over the payback period, but you fund it, maintain it and carry the performance risk. Under RESCO you typically avoid the upfront capital and the maintenance, and pay only for metered units — savings can start from month one, depending on the contract and actual generation. Companies that want savings without capital lock-in or operational overhead often prefer RESCO, even when they could afford CAPEX.
Is there GST on solar power bought under a RESCO PPA? The supply of electrical energy is exempt from GST. On this project the invoices are raised with no GST, citing Notification 2/2017-Central Tax (Rate), Sr. No. 104. The exact tax treatment of any particular invoice should be confirmed against the applicable notification, the PPA and the nature of the amounts charged, so have it reviewed by your GST adviser.
How do you know the plant is actually generating what was promised? Generation is metered on the monthly invoice, and in this case study it is also compared against the World Bank Group's Global Solar Atlas modelled estimate for the exact site. Over March–August 2026 the plant ran at about 91% of that modelled estimate. The Atlas is a long-term planning model, not an independent audit of the plant — but comparing metered output against an outside reference is a more honest check than quoting the developer's own projection.
Who maintains the plant under RESCO? Typically the developer does, for the full PPA term — financing, cleaning, monitoring and operations and maintenance — though the exact scope depends on the contract. Under this project's PPA the customer carries no O&M cost or responsibility, and because billing is on units generated, there is a built-in incentive for the developer to keep the plant performing.